 Rare Maps
  Rare Atlases
  Rare Books
  Rare Prints
  Globes and Planetaria
 Sign up to hear about our latest acquisitions, exhibitions and events


Find Us
New York
PO Box 329, Larchmont, NY, USA
Opening hours, London Gallery
Monday to Friday: 10:00 – 18:00
Saturday: by appointment
Closed: all bank holidays and 1-31 August
Opening hours, New York
By appointment only
Opening hours

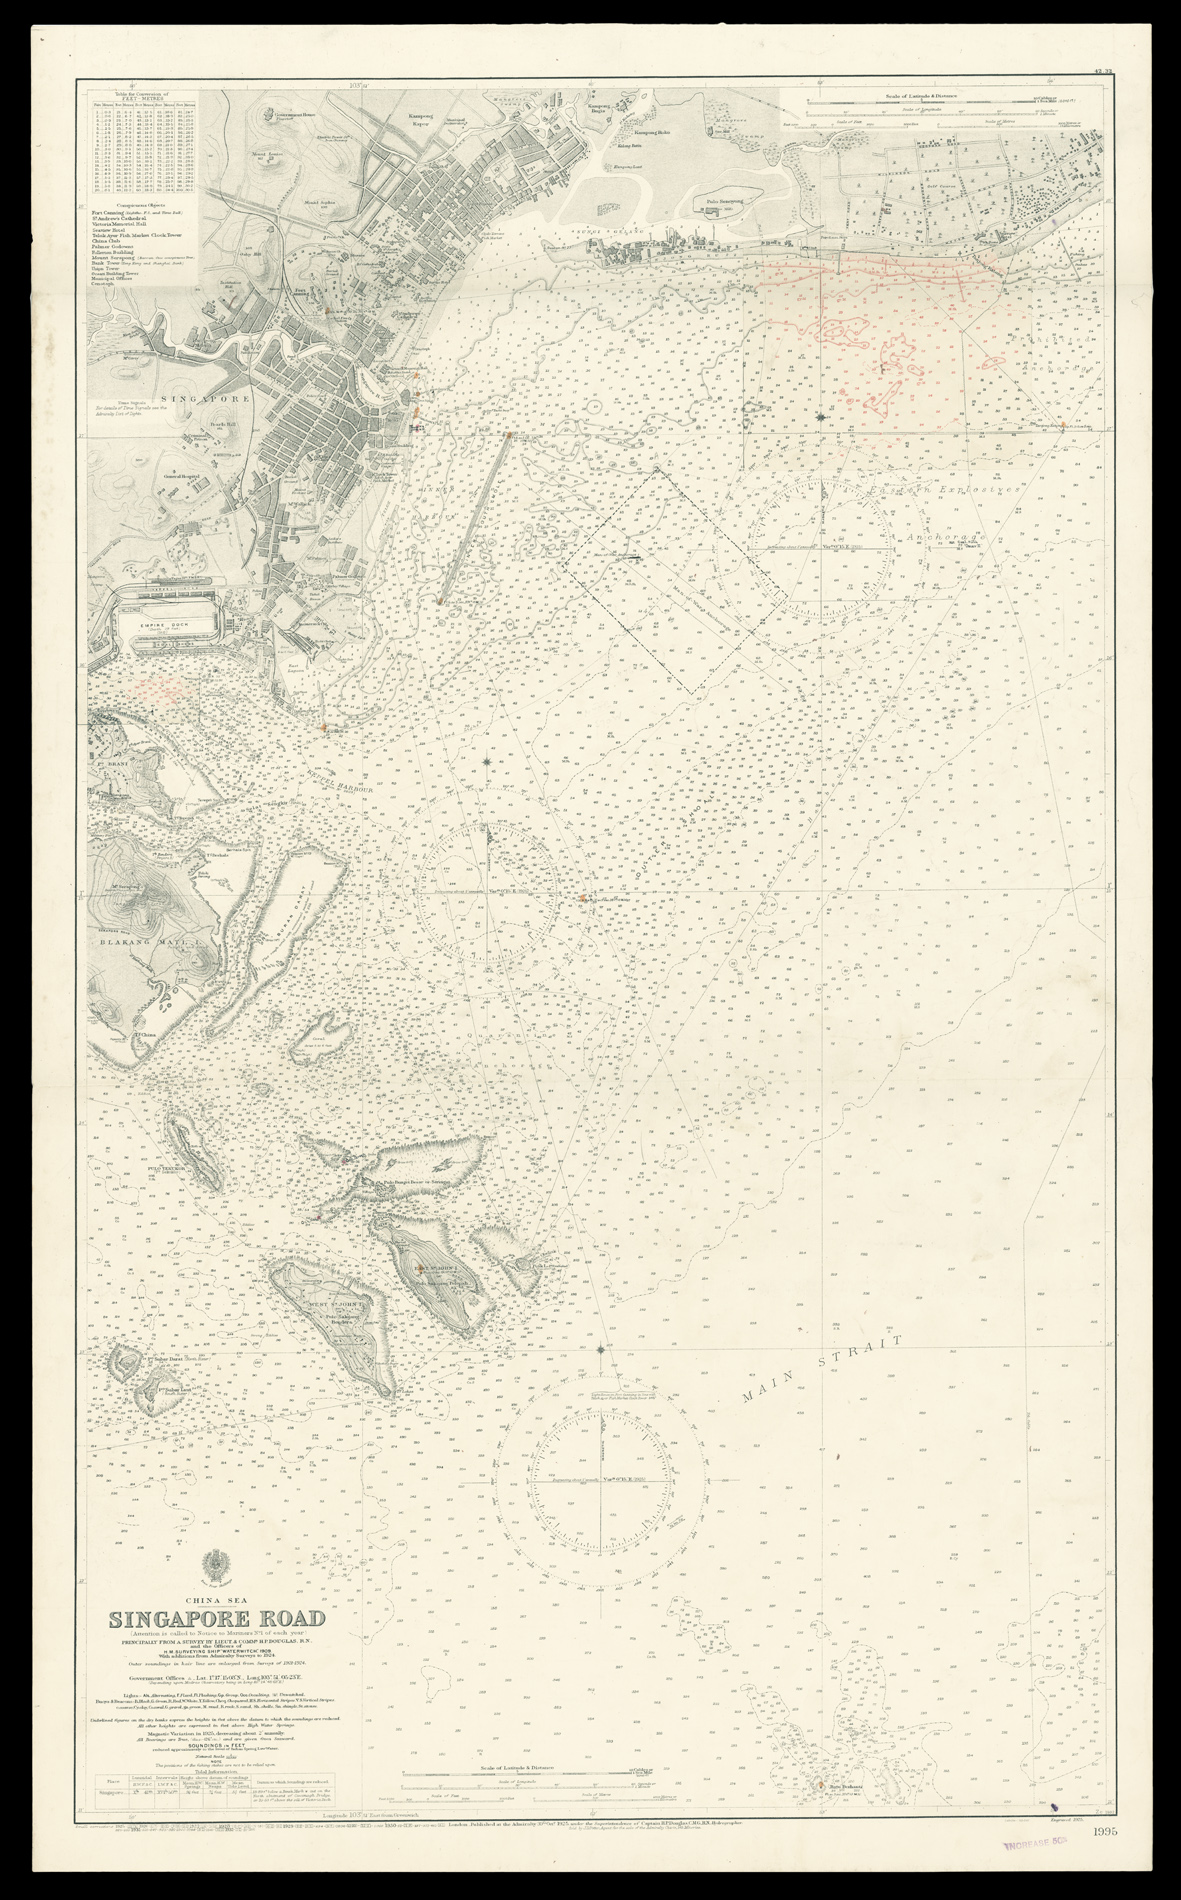
China Sea. Singapore Road. (Attention is called to Notice to Mariners No.1 of each year) Principally from a Survey by Lieut. & Commr. H.P. Douglas R.N. and the Officers of H.M. Surveying Ship “Waterwitch” 1909.
- Author: HYDROGRAPHIC OFFICE
- Publication place: London
- Publisher: Published at the Admiralty
- Publication date: 30th Oct., 1925. Small corrections to 1932.
- Physical description: Engraved chart, including tidal information, compass roses, soundings, seabed notations, currents, sandbanks, shoals, lighthouses and beacons picked out in yellow and red, inland elevations and detailing, and buildings, paste-over printed in red.
- Dimensions: 1170 by 710mm. (46 by 28 inches).
- Inventory reference: 1439
Notes
Detailed chart of Singapore Road.
Singapore was at the time undergoing significant dock and naval works in order to counter the increasingly ambitious Japanese Empire. The works – completed in 1939 at the cost some $500,000 – boasted the largest dry dock in the world, the third largest wet dock, and enough fuel tanks to support the entire Royal Navy for six months. The city was protected from naval attack by Royal Naval 15 inch guns and a Royal Air Force squadron based at Tenagh Air Base. Churchill was proud enough of its fortifications to boast of it as the “Gibraltar of the East”. However, pride often comes before a fall and on the 15th February 1942, after just 15 days of fighting Singapore was under Japanese control. Some 130,000 allied troops were taken prisoner; Churchill called it the “worst disaster and largest capitulation in British history”.
The British Hydrographic Office was founded in 1795 by George III, who appointed Alexander Dalrymple as the first Hydrographer to the Admiralty. The first charts were produced in 1800. Unlike the U. S. Coast Survey the Hydrographic Office was given permission to sell charts to the public and they produced a great number of sea charts covering every corner of the globe. Most of the Admiralty charts produced by the Hydrographic Office delineated coastline as well as high and low water marks and record depth of water as established by soundings. In addition these charts included information on shoals, reefs, and other navigational hazards that plagued mariners across the world. Thanks to the innovations of Sir Francis Beaufort, who developed the Beaufort Scale of wind strength, the British Hydrographic Office became one of the leading producers of sea charts. In fact, such was their accuracy that the phrase ‘Safe as an Admiralty Chart’ was coined.
Related items


Sign up to hear about our latest acquisitions, exhibitions and events
Find Us
New York
PO Box 329, Larchmont, NY, USA
Opening hours, London Gallery
Monday to Friday: 10:00 – 18:00
Saturday: by appointment
Closed: all bank holidays and 1-31 August
Opening hours, New York
By appointment only